
A well-oiled sales pipeline is key to profitability. But with so many moving parts, it can be difficult to know where to focus your efforts. Understanding sales pipeline metrics help you figure out what’s working, what’s not, and where you need to make changes to drive up revenue.
However, without proper tracking and sales pipeline analysis, it’s easy for a sales team to get caught in a cycle of inefficiencies, causing your funnel to dry up. Leads can slip through the cracks, conversions can lag, and sales cycles can slow down, leading to missed revenue opportunities and wasteful spending.
To help analyze your pipeline and optimize it for growth, let’s start at the beginning: lead generation.
Get the Ultimate Guide to Maximizing Channel Sales
1. New Qualified Leads
Clearly, it’s crucial to keep the funnel filled with new leads if you want to ensure success in the sales process. But how many new qualified leads do you have coming into your funnel?
Tracking this number will give you a solid foundation for the rest of your pipeline analysis and help you make calibrated decisions to improve your bottom line.
We recommend our clients track this metric on a weekly basis to understand any ebbs and flows in lead volume — and to identify any stages in the sales process where the team is facing challenges, which may need additional attention and resources.
By tracking the number of new qualified leads per week, you can get a clear understanding of the effectiveness of your sales activities and the progress towards your goals.
A low rate of new leads may indicate a need for creative lead generation strategies, such as outsourcing appointment setting or launching different marketing campaigns.
2. Conversion Rates Per Stage
It’s impossible to improve your overall win rate or allocate resources intelligently if you don’t know what’s holding you back.
By tracking individual conversion rates (the percentage of leads that move from one stage of the sales pipeline to the next), you can not only determine the number of new leads you need to get the results you want, but also identify exactly which stages of the pipeline are creating bottlenecks.
We covered these stages in more detail in our post about sales pipeline stages, but to review, here are some of the primary conversion points where you’ll want to measure rates:
- Leads to Marketing Qualified Leads (MQLs)
- MQLs to Sales Qualified Leads (SQLs)
- SQLs to Sales Accepted Leads (SALs)
- SALs to Closed-Won
For example, if only 10% of your leads are converting into SALs (Sales Accepted Leads), then you know exactly how many new leads you need to bring in each week, month, and quarter to hit your sales targets. But if you notice an abysmal conversion rate from MQL to SQL, then fixing it will reduce the number of leads you need.
Furthermore, these conversion metrics will give you a better sense of how your targeting and messaging is resonating with your target audience at each stage.
For a deeper dive into the key areas you should keep an eye on, check out our post on sales team performance metrics.
3. Sales Pipeline Velocity
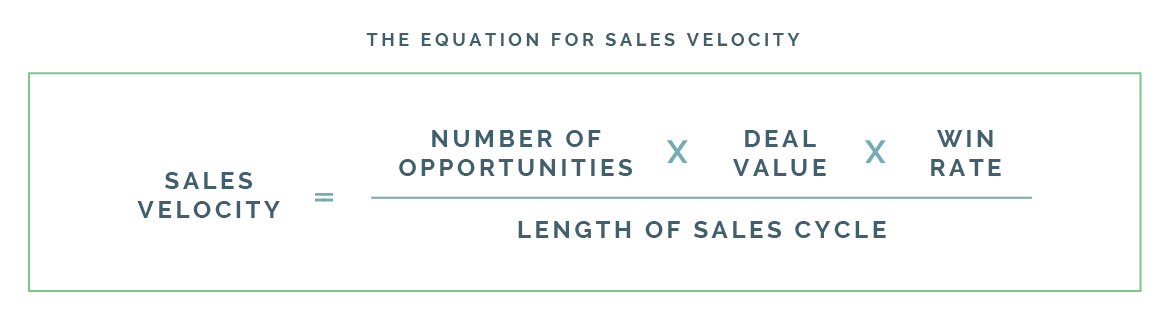
Sales pipeline velocity measures the speed at which your sales process moves all the way from lead (through MQL, SQL, and SAL) to closed business. It’s like a speedometer for your sales funnel.
Sales velocity can be found by multiplying the number of opportunities, average deal value, and win rate together and then dividing that number by the length of the average sales cycle.
By regularly tracking and improving sales pipeline velocity, you can identify areas where you need to streamline your processes to improve cycle times.
For instance, say your sales pipeline velocity begins to slow. By tracking this metric, you notice this early and may discover that deals are beginning to get held up in a certain stage of your process. Now you can dig into the issue right away to get things back to moving quickly.
Note: inbound sales will usually have a faster cycle time because the customer has already identified a need, whereas outbound sales will have a longer cycle time due to the educational aspect involved in bringing the customer into the buying process. Outbound sales cycle times are typically three times longer than inbound sales cycle times.
4. Pipeline Value Per Stage
Picture a leaky bucket with holes at every stage of your sales process. Each time you lose a deal during the sales process, valuable water (or in this case, revenue) leaks out.
If you have a lot more value in late stages than early stages, it can be a sign that you need to work on filling the pipeline (via lead gen). If the opposite is true (lots of leads in the early stages, very few at the end), it can be a sign that you need to work on the conversion rates between stages.
Tracking pipeline value per stage (by adding up the total value of each deal in a given stage) can help you spot these issues.
Say you’re SaaS company and you notice that you have a lot of value in the early stages but less in the later stages. In this case, you may need to work on improving your product demo or trial process to increase the conversion rate from trial to purchase.
Meanwhile, if your trials or demos are great at converting into sales, but your deal value in the early stages isn’t that much bigger, you may need to step up your marketing or outbound sales efforts to address the untapped opportunity.
5. Tracking Sales Rep Performance
Imagine a race where every sales rep is a runner, each with their own unique strengths and weaknesses. To win the race, you need to know how each runner is performing, where they need to improve, and how you can help them reach the finish line.
The same is true for sales teams. To drive success, you need to track each sales rep’s performance, including their new leads generated, conversion rates, individual cycle time, and pipeline value per stage. This information will help you identify which reps are performing well and which ones need additional support or coaching.
For example, let’s say you have two sales reps: Rep A and Rep B. After tracking their performance, you discover that:
- Rep A consistently generates high-quality leads, has a strong conversion rate, and consistently closes deals at a high value.
- Rep B, by comparison, does okay at generating leads but has a low conversion rate.
By tracking their performance, you can provide Rep B with additional support and resources to help improve their skills in closing, and perhaps in higher quality lead generation.
Improve these pipeline metrics with higher lead volume
The key to any sales pipeline’s health is a steady flow of new leads. Lead generation should be a continuous process for a few reasons:
- Consistently generating new leads helps eliminate most pipeline woes, in part by ensuring your entire pipeline remains full.
- The number of leads needed to hit your sales targets may fluctuate over time.
- A larger lead pool gives you more opportunities to identify bottlenecks throughout the pipeline.
If you find that you’re struggling to generate leads, consider outsourcing the task to a specialized team. By optimizing your conversion rates at each stage, with a steady flow of leads, you’ll be well on your way to nailing your sales targets.
Considering Outsourced Sales Development?
Take a peak at how B2B sales teams can overcome economic uncertainty.
